Visual Application: Scatterplots and Strength of Correlation
Yuriy Davydenko
May 11 2020
Scatterplots and Strength of Correlation
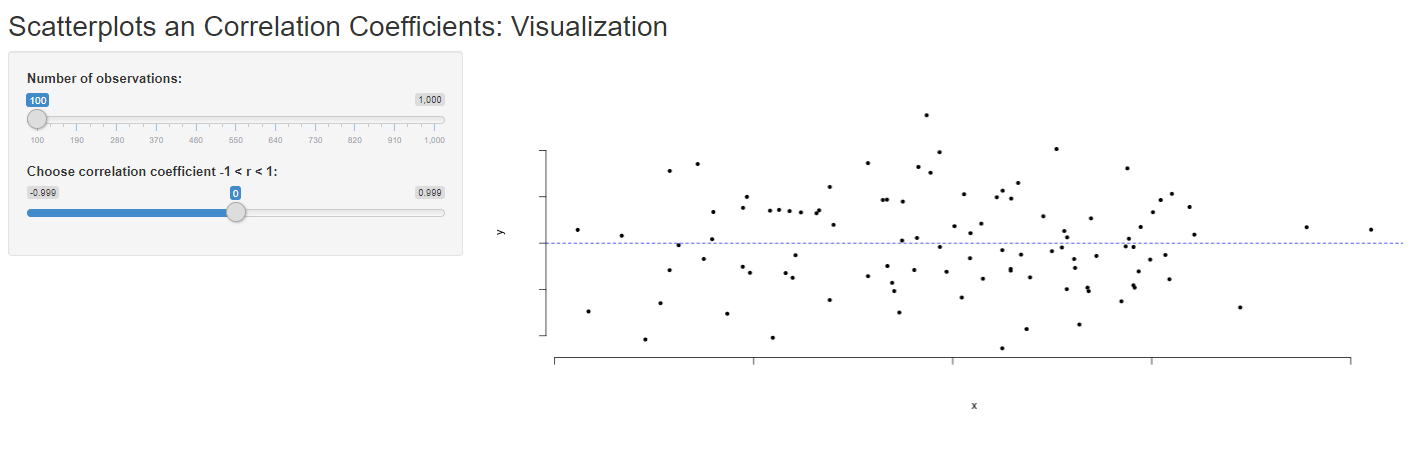
Simulate a scatterplot by defining a number of observations and a correlation coefficient. Observe how the scatterplot changes as the correlation coefficient changes from zero to one.
Open the visual applet in a new window