T-Distributions: Finding Critical Values
Yuriy Davydenko
May 11 2020
Finding Critical Values of the t-statistic for Hypothesis Testing and Confidence Intervals
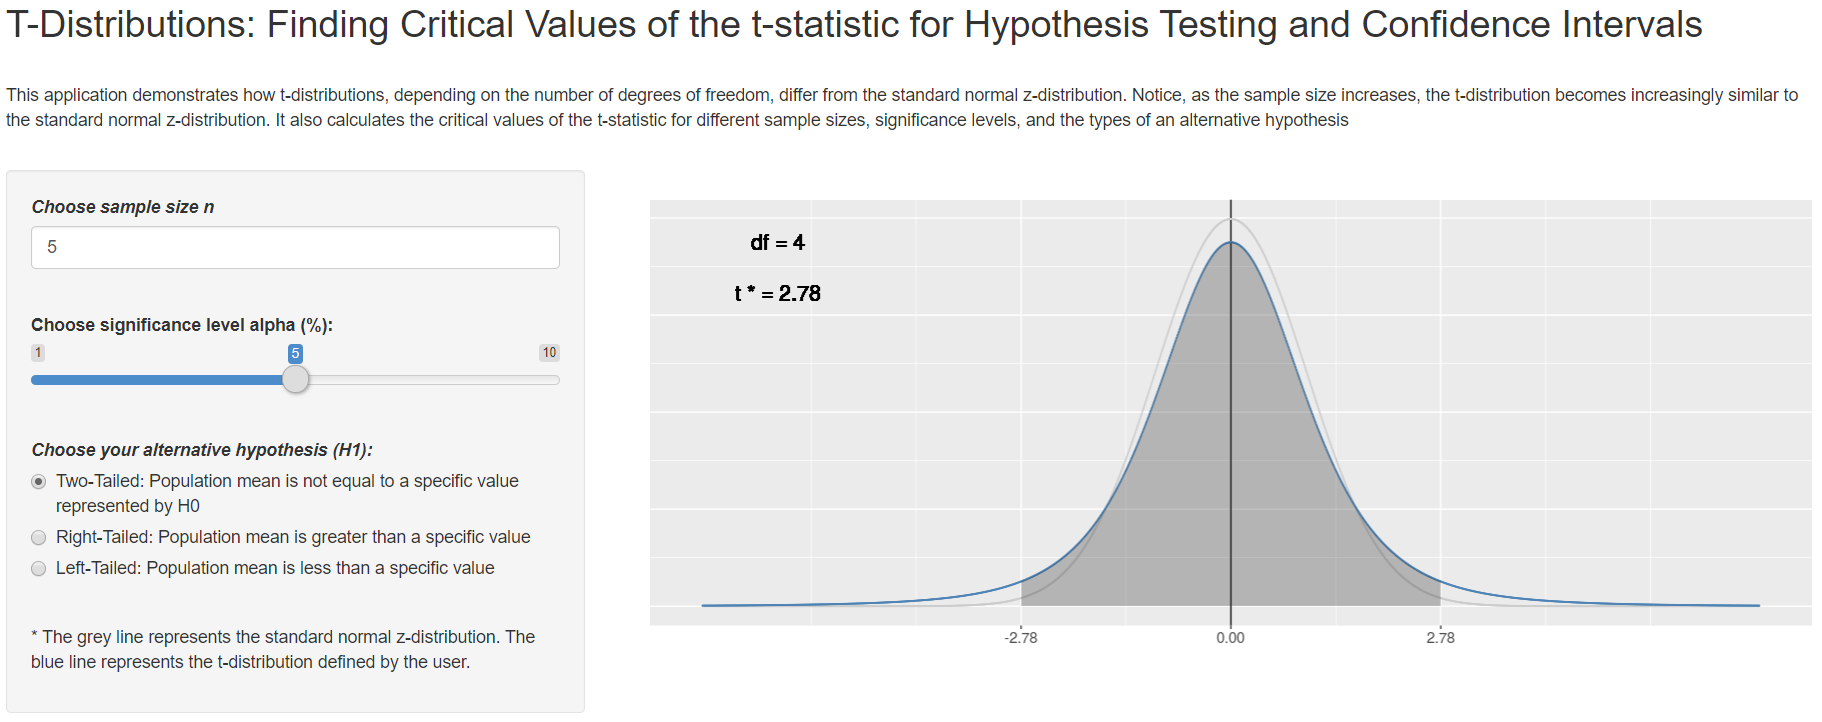
This application demonstrates how t-distributions, depending on the number of degrees of freedom, differ from the standard normal z-distribution. Notice, as the sample size increases, the t-distribution becomes increasingly similar to the standard normal z-distribution. It also calculates the critical values of the t-statistic for different sample sizes, significance levels, and the types of an alternative hypothesis.