Sampling Distributions: Simulation
Yuriy Davydenko
May 11 2020
Observe the Law of Large Numbers and the Central Limit Theorem by Simulating Simple Randowm Draws
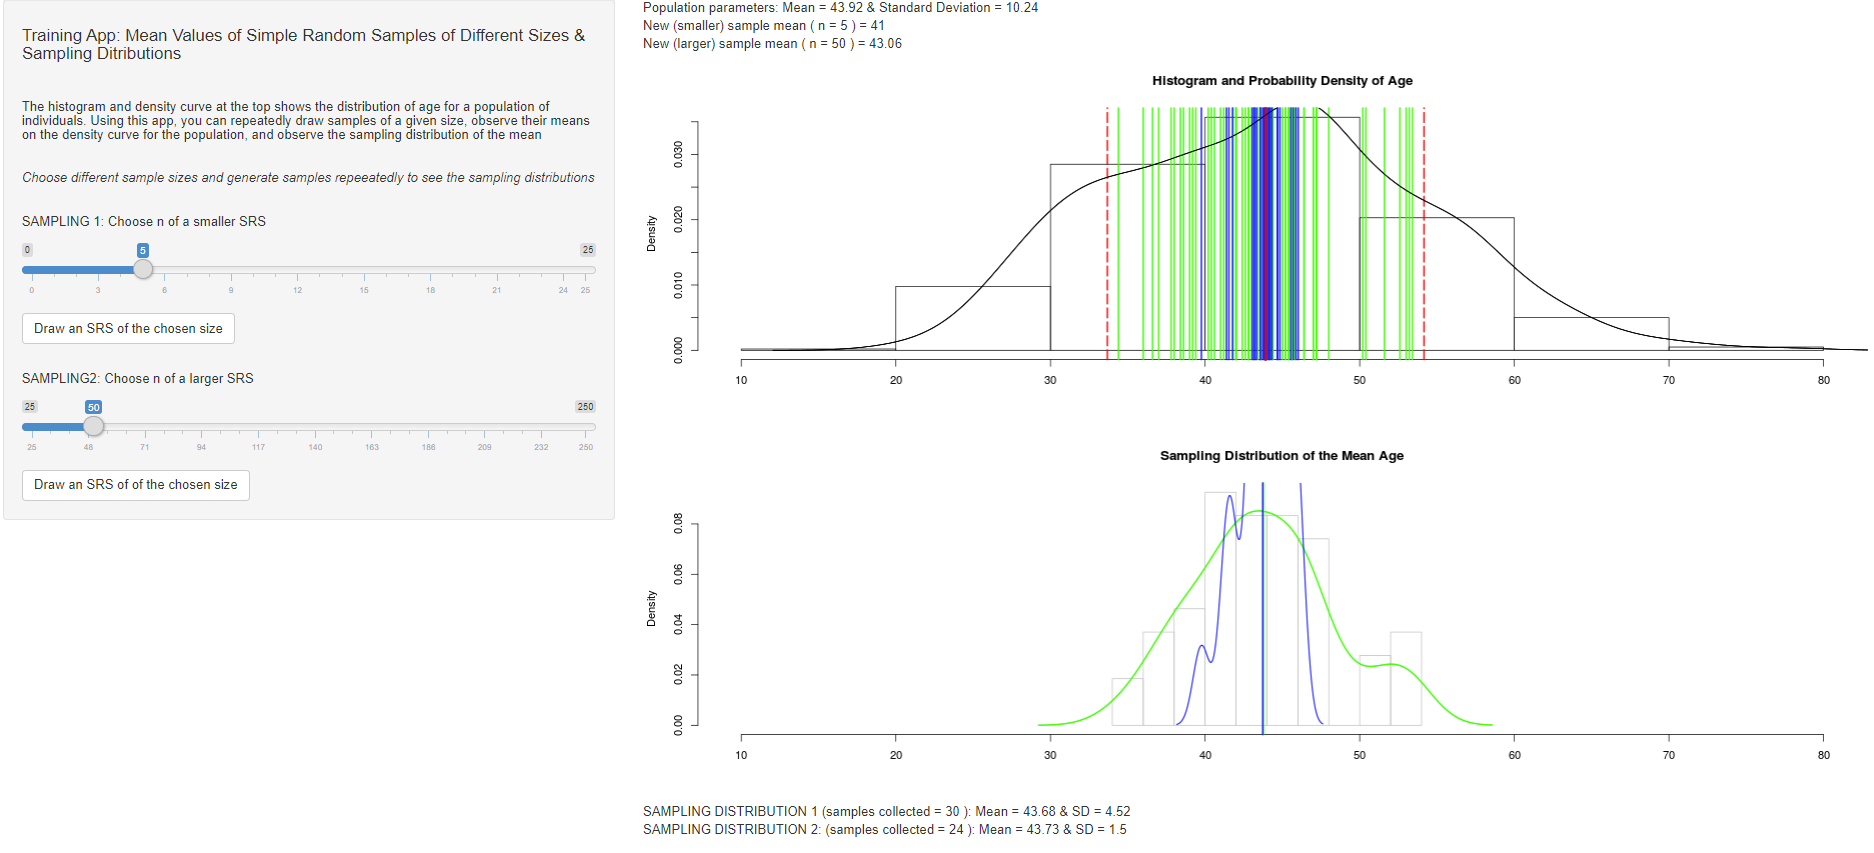
This simulation visualizes the distribution of a variable (age) in a population of individuals. Using this applet, you can repeatedly draw samples of a given size, observe their means on the density curve for the population, and observe the sampling distribution of the sample mean.
Choose different sample sizes and draw samples repeeatedly to see how the sampling distributions change.